Northwest MLS reported strong increases in sales, inventory and prices during October
November 20, 2024
Pending sales of single family homes and condos in counties served by Northwest Multiple Listing Service (NWMLS) jumped nearly 27% during October compared to the same month a year ago.
Last month’s volume of mutually accepted offers surged more than 30% in King County and more than 42% in Kittitas County, according to the NWMLS report.
In its summary of October activity, the MLS reported inventory increased 29.75% year-over-year (YoY). The number of total active listings rose from 11,403 to 14,795. Brokers added 7,726 new listings during the month, up about 26% from a year earlier.
In King County, the number of active listings rose more than 35%, while Kittitas County reported a gain of nearly 31%. Despite the improvement, the selection for buyers remains constrained.
NWMLS said there was 2.28 months of supply at the end of October. That was a slight decline from September when there was 2.7 months of supply. King County had 1.98 months of supply and Kitsap’s reported 5.25 months. Many industry observers use a range of four-to-six months as an indicator of a balanced market.
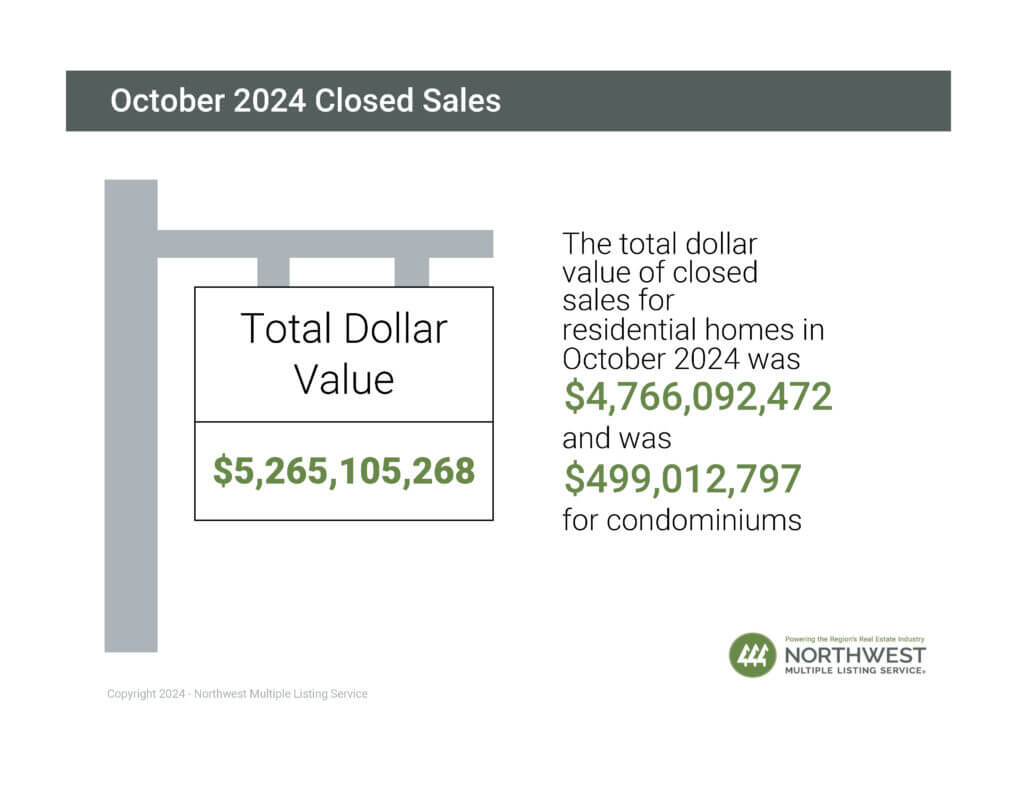
Brokers also reported a 22.45% increase in closed sales, rising from 5,291 a year ago to 6,479. Those transactions had a total dollar value of more than $5.2 billion.

Twenty counties experienced a double- or triple-digit gain in volume. The number of completed transactions in King County rose nearly 29%, but Kittitas County had a slight drop, down 8%. Closed sales rose year-over-year in 22 of the 26 counties in the report.
Mortgage rates for a 30-year fixed rate loan inched up last month according to Freddie Mac data. The rate was 6.12% on October 3 and 6.72% on October 31.
One economist at a property data company expects rates to rise under the Trump administration.
Selma Hepp, chief economist at CoreLogic Inc., told an editor with the Business Journals that the presidential election outcome “had an immediate impact on the cost of bonds and mortgage rates.” Commenting on the correlation of mortgage-rate movement and 10-year Treasury bond yields, she said yields tend to rise when investors expect stronger economic growth and the potential for inflation. Given the market expectation of more deficit spending under the next administration, the cost of U.S. debt will rise. “The cost of bonds and mortgage rates being priced off the 10-year Treasury will go up,” she stated.
National Association of Realtors® Chief Economist Lawrence Yun expects mortgage rates to hover around 6% during the next two years. “Are we going to go back to 4%? Per my forecast, unfortunately, we will not,” he remarked. He believes the “new normal” will bounce between 5.5% and 6.5%, with six to eight more interest rates cuts during this period. Median home prices will increase 2% in both years, he predicts.
Prices across Washington state continued their upward trend last month. System-wide, the median price for October’s closed sales was $650,000. That was up almost 8% from the year-ago price of $602,000.
In King County, the median price on last month’s sales was $865,000 topping the other 25 counties in the report. YoY prices in that county rose 8.13% from a year ago.
Prices in Kittitas County surged about 14.6% compared to a year ago, rising from $515,000 to $590,000.
Keyboxes at listed properties were accessed 146,608 times in October. That was a decrease of 7% when compared to September, but an increase of 16% compared to October 2023.
The number of property showings scheduled through NWMLS-provided software increased 18% YoY, but dropped 8% when compared to September.
Snapshot – NWMLS all counties, King County, Kittitas County
All NWMLS counties | King County | Kittitas County | |
| NEW LISTINGS | |||
| October 2024 | 7,726 | 2,831 | 113 |
| October 2023 | 6,134 | 2,157 | 78 |
| % change | 25.93% | 31.24% | 44.87% |
| ACTIVE LISTINGS | |||
| October 2024 | 14,795 | 4,552 | 362 |
| October 2023 | 11,403 | 3,361 | 277 |
| % change | 29.75% | 35.44% | 30.69% |
| MONTHS OF INVENTORY | |||
| October 2024 | 2.28 | 1.98 | 5.25 |
| October 2023 | |||
| PENDING SALES | |||
| October 2024 | 7,199 | 2,488 | 77 |
| October 2023 | 5,684 | 1,905 | 54 |
| % change | 26.65% | 30.6% | 42.95% |
| CLOSED SALES | |||
| October 2024 | 6,479 | 2,303 | 69 |
| October 2023 | 5,291 | 1,788 | 75 |
| % change | 22.45% | 28.8% | -8.0% |
| MEDIAN PRICES | |||
| October 2024 | $650,000 | $865,000 | $590,000 |
| October 2023 | $602,000 | $800,000 | $615,000 |
| % change | 7.97% | 8.13% | 14.56% |
